System Diagnostics & Monitoring
The Diagnostics module provides comprehensive system health monitoring, log viewing, capacity planning, and job management tools for maintaining your DataForeman installation.

Overview
Diagnostics provides:
- System Health Status: Real-time health of all components
- Log Viewer: Centralized access to all system logs
- Capacity Planning: Disk space and retention estimates
- System Metrics: CPU, memory, and disk usage charts
- Job Management: Background task monitoring
- Performance Insights: Identify bottlenecks and issues
System Health Status
The Overview tab shows the status of all DataForeman components:
Component Status Indicators
Backend (Core)
- OK: Main API server is responding
- Description: Fastify server and API logic
- Common Issues: Process crashed, port conflict
Postgres
- UP: Primary database is accessible
- Description: Configuration and metadata storage
- Common Issues: Connection refused, out of disk space
NATS
- OK: Message broker is functioning
- Description: Inter-service messaging
- Common Issues: JetStream not enabled, port busy
TimescaleDB
- UP: Time-series database operational
- Description: Telemetry data storage
- Common Issues: Extension not loaded, disk full
Connectivity
- OK: Device communication active
- Description: Shows number of active device connections
- Common Issues: Network unreachable, firewall blocking
Frontend
- OK: Web UI is serving
- Description: Nginx web server
- Common Issues: Certificate issues, configuration errors
Ingestor
- ACTIVE: Data ingestion worker running
- Description: NATS to TimescaleDB pipeline
- Common Issues: Queue backlog, database write errors
Caddy (Optional)
- UP/DOWN: TLS reverse proxy status
- Description: HTTPS termination
- Note: Only present if deployed with Caddy profile
Status Meanings
- OK / UP / ACTIVE: Component is healthy and functioning normally
- DEGRADED: Component running but with reduced performance
- DOWN: Component is not responding or unavailable
- UNKNOWN: Cannot determine status
Log Viewer
Access system logs without SSH or terminal access:
Log Components
Select from dropdown:
- core: Main API server logs
- connectivity: Device communication logs
- ingestor: Data ingestion worker logs
- nats: Message broker logs
- postgres: Database logs (CSV format)
- ops: Operational scripts and rotator
Filtering Options
Log Level
- All Levels (default)
- INFO: Informational messages
- WARN: Warnings and potential issues
- ERROR: Error conditions
- DEBUG: Detailed debugging information
Text Search
- Type in “Contains…” box to filter messages
- Case-insensitive search
- Searches message content
Limit
- Number of log lines to display (default: 100)
- Adjust for performance vs. completeness
View Options
Newest First (Checkbox)
- ✓ Show most recent logs at top
- ☐ Show oldest logs first (chronological)
Hide Pings (Checkbox)
- ✓ Filter out health check pings
- ☐ Show all messages including pings
- Reduces noise in logs
Auto-Refresh (Checkbox)
- ✓ Automatically reload logs every 5 seconds
- ☐ Manual refresh only
- Useful for monitoring live issues
Log Table Columns
- Time: Timestamp of log entry (local time)
- Level: INFO, WARN, ERROR, DEBUG
- Message: Log message content
Common Log Searches
Find Connection Errors:
Contains: "connection refused"
Level: ERROR
Monitor API Requests:
Component: core
Contains: "POST /api"
Level: INFO
Debug Device Communication:
Component: connectivity
Level: DEBUG
Limit: 500
Capacity Planning
Monitor disk usage and estimate retention capacity:
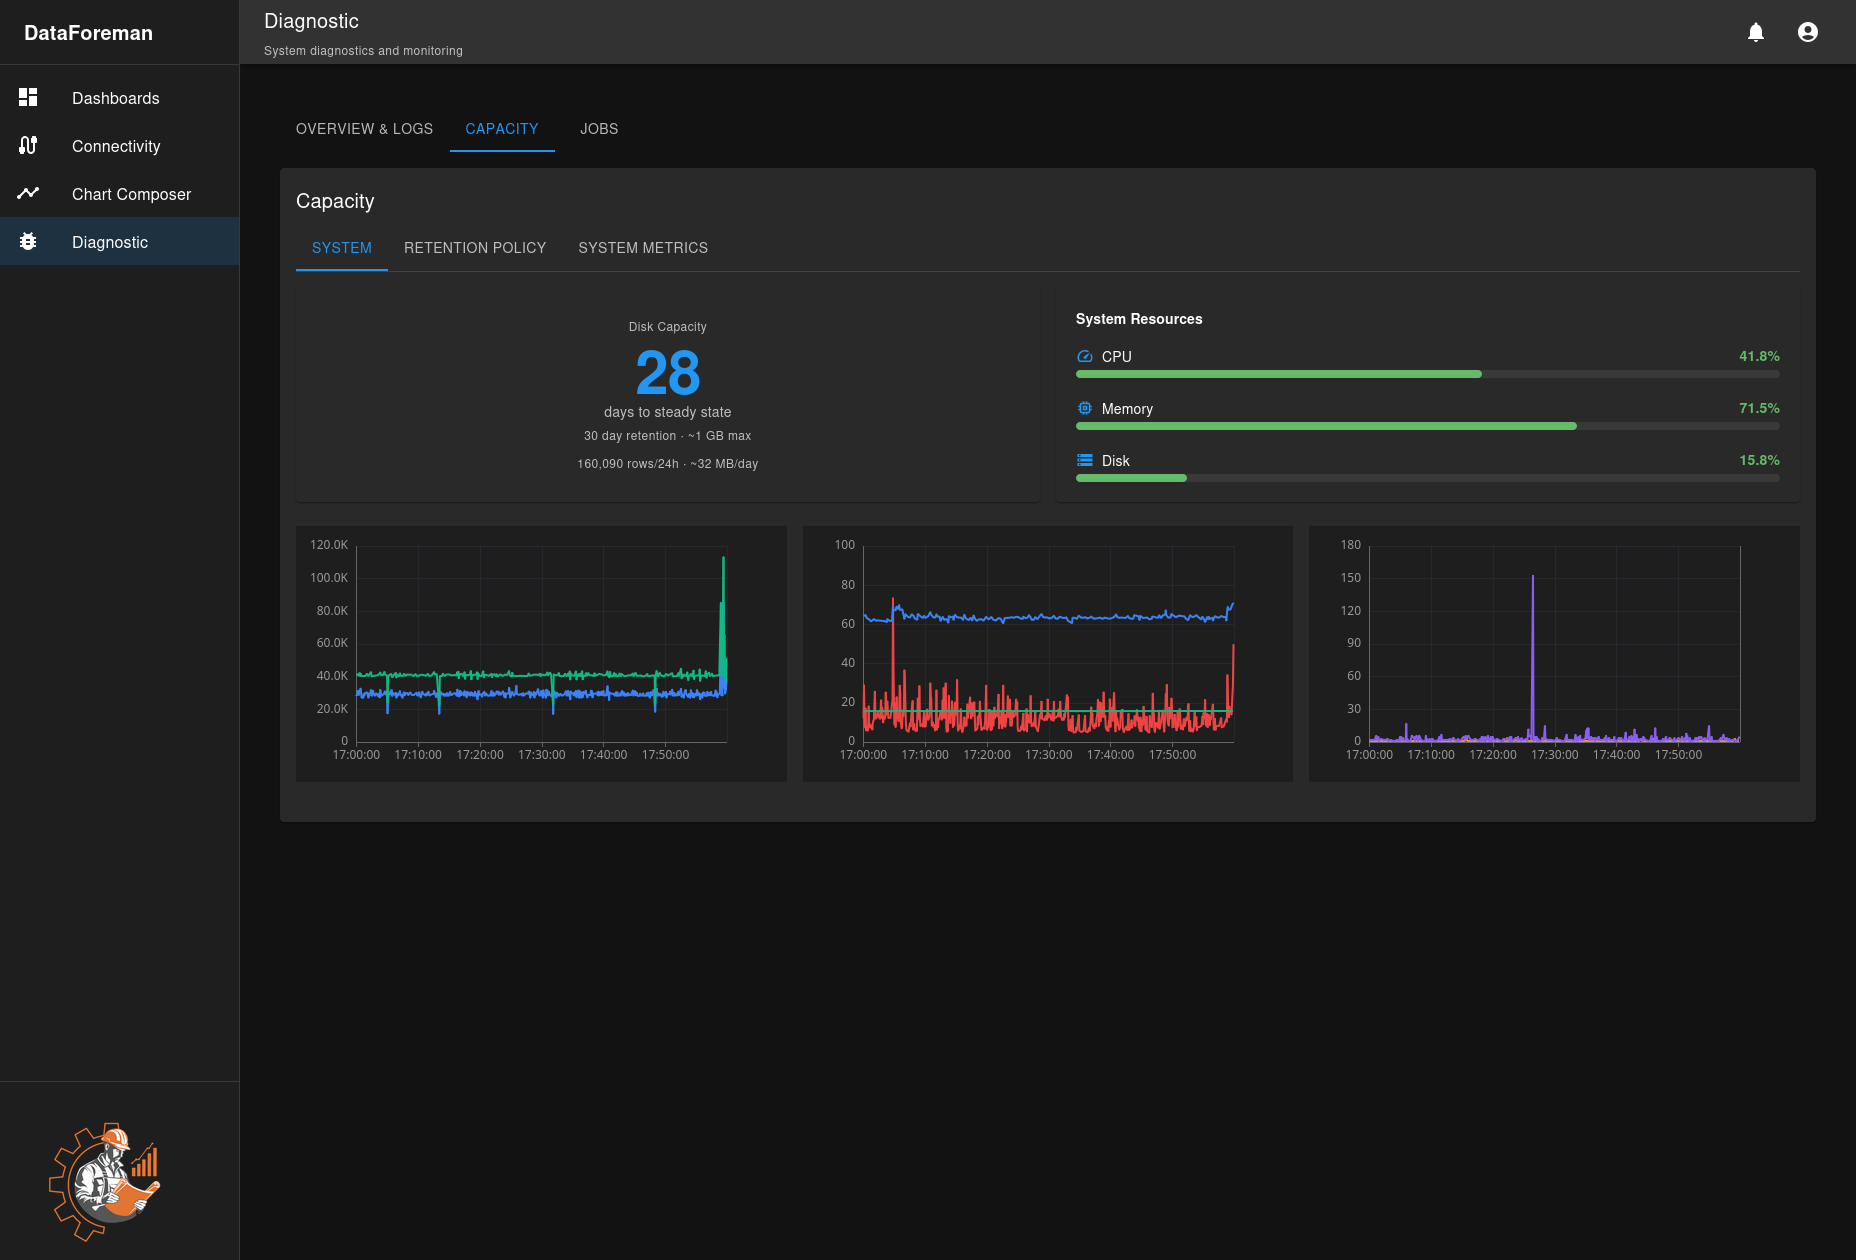
System Tab
Disk Capacity Card
- Days to Steady State: Estimated days until data retention stabilizes
- Retention Period: Configured retention (e.g., 30 days)
- Max Database Size: Expected maximum size at steady state
- Daily Growth: Average data added per day
- Rows per Day: Time-series records inserted daily
System Resources
- CPU Usage: Current processor utilization
- Memory Usage: RAM consumption percentage
- Disk Usage: Total disk space used
Historical Charts Three charts show 24-hour trends:
- CPU Usage Over Time: Processor load patterns
- Memory Usage Over Time: RAM consumption trends
- Disk I/O: Read/write operations per second
Retention Policy Tab
Configure TimescaleDB data retention:
Settings:
- Chunk Interval: Time period for data chunks (default: 1 day)
- Retention Period: How long to keep data (default: 30 days)
- Compression After: When to compress old chunks (default: 7 days)
Actions:
- Enter retention period in days
- Enter compression age in days
- Click Save Configuration
- Policy activates immediately
How It Works:
- Data stored in time-based chunks
- Old chunks compressed to save space (70-90% reduction)
- Chunks older than retention period automatically deleted
- Cleanup job runs every 30 minutes
Example:
- 1-day chunks, 30-day retention, 7-day compression
- Days 0-7: Uncompressed, recent data
- Days 8-30: Compressed, historical data
- Day 31+: Automatically deleted
System Metrics Tab
Detailed performance metrics:
- Database Size: Current database disk usage
- Table Sizes: Size breakdown by table
- Index Statistics: Index usage and performance
- Query Performance: Slow query identification
- Connection Pool: Active database connections
Jobs Management
Monitor background tasks and scheduled jobs:
Job Types
Log Rotation
- Frequency: Every 24 hours
- Function: Rotate log files, maintain retention
- Status: Last run time, next scheduled run
Data Retention
- Frequency: Every 30 minutes
- Function: Drop old TimescaleDB chunks
- Status: Last cleanup, chunks removed
Compression
- Frequency: Daily
- Function: Compress old time-series data
- Status: Compression ratio, time saved
Backup (If configured)
- Frequency: Configured schedule
- Function: Database backup creation
- Status: Last successful backup
Job Status Indicators
- Active: Job is currently running
- Scheduled: Next run time shown
- Completed: Last run finished successfully
- Failed: Last run encountered errors
- Disabled: Job is not scheduled
Managing Jobs
View Job Details:
- Click any job to see execution history
- View output logs
- Check error messages
- See performance metrics
Manual Execution:
- Click Run Now to trigger immediately
- Useful for testing or immediate cleanup
- Does not affect schedule
Enable/Disable:
- Toggle jobs on/off without deleting
- Useful for maintenance windows
Troubleshooting
Component Down
Backend (Core) Down:
- Check if Docker container is running:
docker ps - View container logs:
docker logs dataforeman-core-1 - Restart:
docker compose restart core
Database Not Accessible:
- Verify database container:
docker ps | grep postgres - Check disk space:
df -h - Review logs in Log Viewer
- Restart database:
docker compose restart db
Connectivity Issues:
- Check network connectivity to devices
- Review connectivity logs
- Verify firewall rules
- Restart connectivity service
High Resource Usage
High CPU:
- Check System Metrics tab for patterns
- Review running jobs
- Reduce query frequency on dashboards
- Optimize slow database queries
High Memory:
- Check for memory leaks in logs
- Reduce cached data
- Restart affected services
- Review query complexity
High Disk I/O:
- Check if backup or compression running
- Review query patterns
- Optimize indexes
- Consider faster storage
Logs Not Showing
- Check Component Status: Ensure service is running
- Verify Log File Permissions: Run
./fix-permissions.sh - Review Rotator Status: Check ops logs for rotation errors
- Disk Space: Ensure logs directory has space
Performance Monitoring
Key Metrics to Watch
Daily Checks:
- System Health Status: All components OK/UP
- Disk Usage: Below 80%
- Days to Steady State: Expected value
Weekly Reviews:
- CPU and Memory trends
- Log error counts
- Job execution success rates
- Database growth rate
Monthly Analysis:
- Capacity planning validation
- Performance optimization opportunities
- Log retention policy review
- Component upgrade planning
Alert Thresholds
Consider alerts for:
- Any component DOWN for > 5 minutes
- CPU > 90% for > 10 minutes
- Memory > 95% for > 5 minutes
- Disk > 90% full
- Job failures > 3 consecutive
Best Practices
Regular Maintenance
- Review Logs Weekly: Check for warning patterns
- Monitor Capacity: Adjust retention before disk fills
- Job Health: Verify all jobs running successfully
- Component Updates: Keep Docker images current
Capacity Planning
- Baseline Metrics: Establish normal usage patterns
- Growth Projection: Estimate future data volume
- Retention Tuning: Balance history needs vs. disk space
- Storage Expansion: Plan upgrades before 80% full
Log Management
- Appropriate Levels: Use DEBUG only when troubleshooting
- Regular Review: Check ERROR and WARN logs daily
- Archival: Export important logs before rotation
- Correlation: Cross-reference logs between components
Security
- Access Control: Limit diagnostics to administrators
- Log Sanitization: Ensure no sensitive data in logs
- Audit Trail: Review who accessed diagnostics
- Secure Export: Protect exported logs and metrics
Keyboard Shortcuts
- Ctrl+R: Refresh logs manually
- Ctrl+F: Find in logs (browser find)
- Esc: Clear search filter
Next Steps
- Configure Data Retention Policy
- Set up Performance Monitoring
- Learn about Backup and Restore
- Review Security Best Practices