Flow Studio
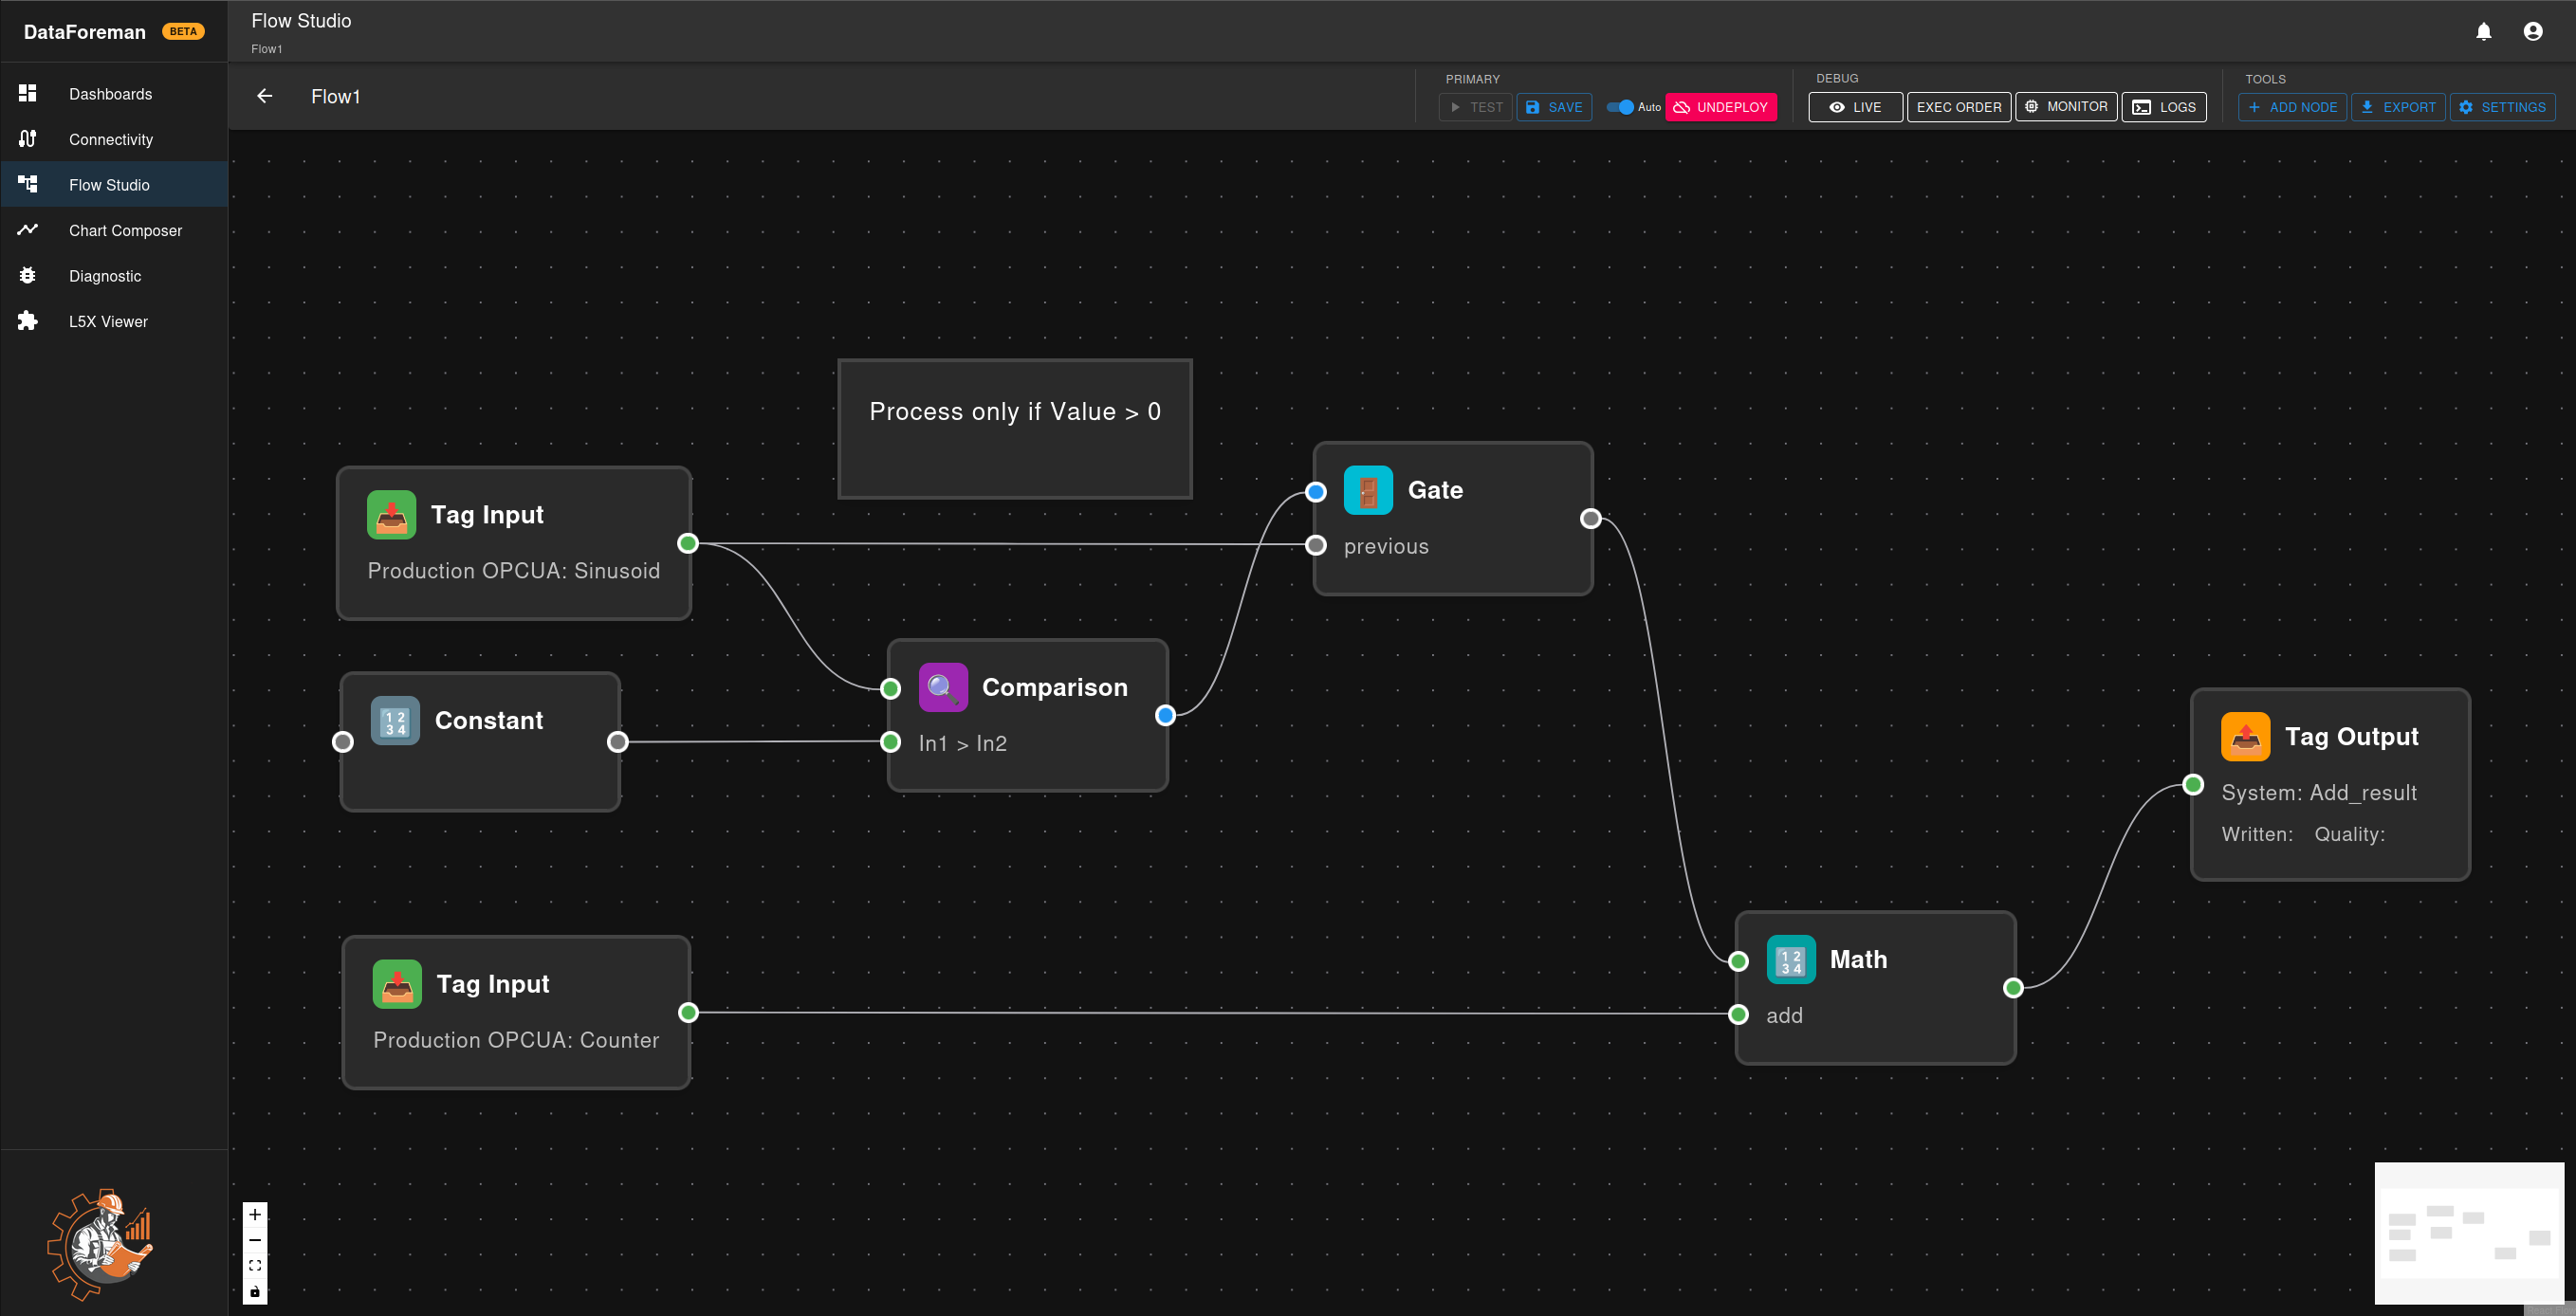
Flow Studio is DataForeman’s visual programming environment for creating data processing workflows. Build complex automation, calculations, and data transformations by connecting nodes in an intuitive drag-and-drop interface.
Overview
Flow Studio provides:
- Visual Programming: No-code/low-code workflow creation with drag-and-drop
- Real-Time Processing: Continuous execution at configurable scan rates (100ms-60s)
- Manual Execution: On-demand workflows for batch processing and reports
- Live Monitoring: Watch data flow through your workflow in real-time
- Node Library: Pre-built nodes for common operations with extensible architecture
- Test Mode: Safe testing environment with write protection
- JavaScript Integration: Custom code execution for advanced logic
Key Concepts
Flow States
Flows exist in one of three states:
- Draft: Flow is being edited, not active
- Test Mode: Temporary deployment for testing with optional write protection
- Deployed: Flow is live and running continuously
Execution Modes
Continuous Mode:
- Runs in a loop at configured scan rate (100ms-60s, default: 1s)
- Requires deployment to start
- Real-time monitoring with live values
- Automatic session management
- Ideal for: Real-time calculations, monitoring triggers, continuous data processing
Manual Mode (default):
- Runs once per execution request
- No deployment needed - execute directly from Flow Browser or Dashboard
- Supports parameterized inputs and outputs
- Ideal for: Report generation, batch operations, data exports, scheduled tasks
Configure in: Flow Settings → Execution Mode toggle
Building Your First Flow
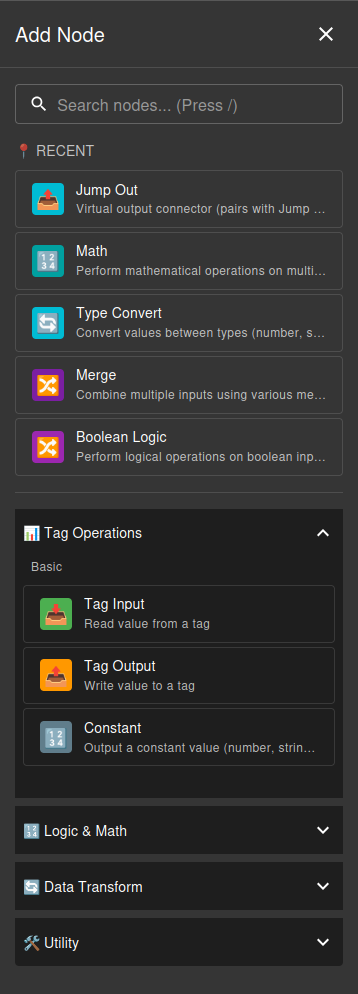
Step 1: Add Nodes
Click the + ADD NODE button in the toolbar or press / to open the node browser. Browse available nodes organized by category:
- Tag Operations - Input/output nodes for reading and writing tag values
- Logic & Math - Processing nodes for calculations and conditional logic
- Data Transform - Type conversion and data manipulation nodes
- Utility - Helper nodes for debugging, comments, and flow control
Select a node type to add it to your canvas. See the Available Nodes section below for complete list.
Step 2: Connect Nodes
Connect nodes by dragging from the output connector (right side) to the input connector (left side) of another node. Connections define data flow and execution order.
Data Type Matching:
DataForeman tracks data types and only allows connections between compatible input/output types. Each connector (handle) is color-coded by its data type:
- Blue - Boolean values (true/false)
- Green - Numeric values (integers, floats)
- Orange - String values (text)
- Purple - JSON/Object values
- Red - Trigger signals
- Gray - Main/Any type (flexible, accepts any data)
Connection Rules:
- Same type: Always valid (e.g., green to green)
- Gray (main/any): Can connect to any type (universal)
- String: Accepts most types (flexible conversion)
- Number: Only accepts numeric outputs
- Boolean: Only accepts boolean outputs
- Trigger: Only connects to trigger inputs
If you try to connect incompatible types, the connection will be rejected with an error message explaining the mismatch.
Step 3: Configure Nodes
Click any node to open its configuration panel. Each node type has different properties:
- Tag nodes require tag selection
- Math/Logic nodes need operation configuration
- Utility nodes have specific parameters (delays, messages, etc.)
Refer to node tooltips and help text for specific configuration options.
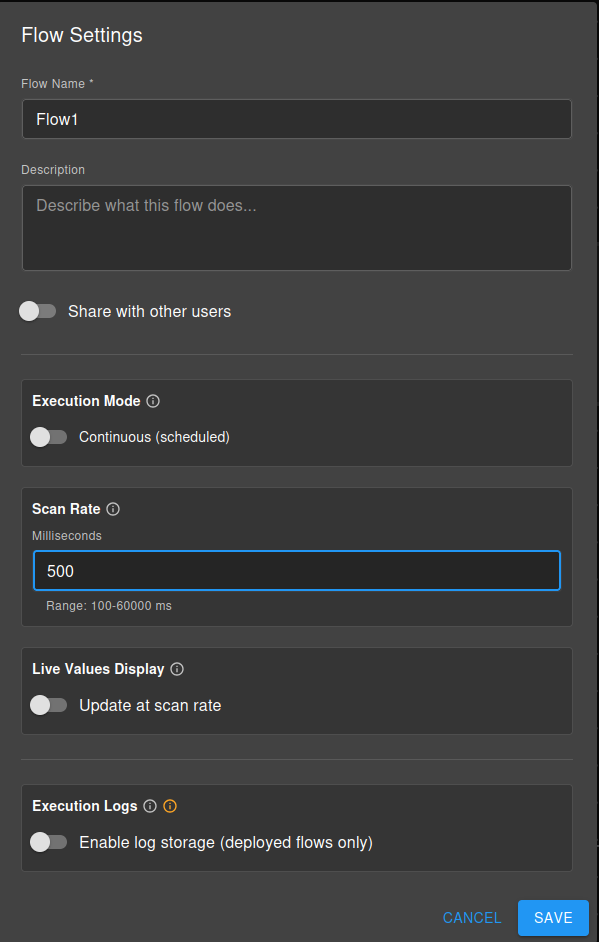
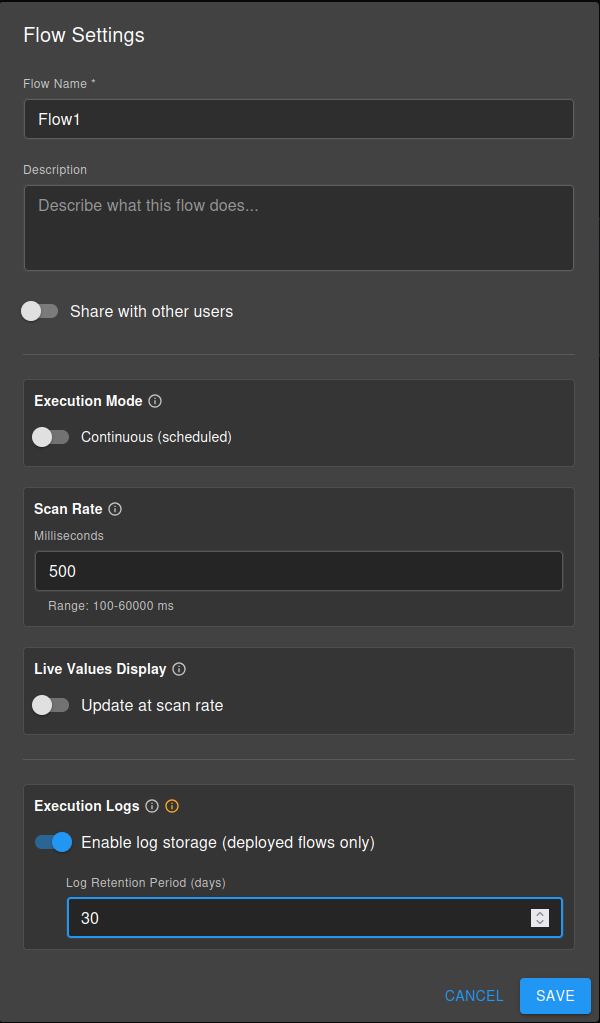
Step 4: Set Execution Settings
Open Flow Settings to configure:
Execution Mode:
- Toggle between Continuous and Manual modes
Scan Rate (Continuous mode only):
- Set loop interval: 100-60000ms (default: 1000ms)
Parameters (Optional):
- Expose node inputs/outputs for runtime configuration
- Toggle “Expose to user” in node configuration
Step 5: Test Your Flow
Test Run (Continuous Mode):
- Click Test Run button
- Configure test options:
- Disable writes: Tag-output nodes skip writing (safe testing)
- Auto-exit: Automatically exit after timeout (1-60 minutes)
- Click Start Test
- Monitor live values flowing through nodes
- Test manual triggers (clickable in test mode)
- Stop test anytime with Stop Test button
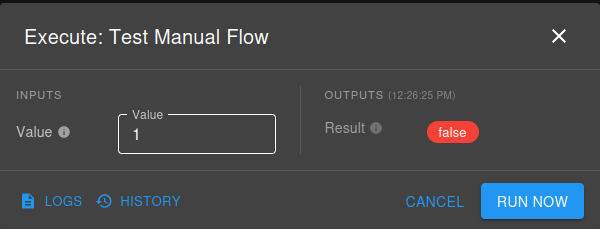
Execute (Manual Mode):
- Click Execute button
- Provide parameter values if configured
- Review execution results
- No deployment required
Step 6: Deploy (Continuous Mode Only)
Once testing is complete, click Deploy to activate continuous execution. Manual mode flows don’t require deployment - they execute on-demand.
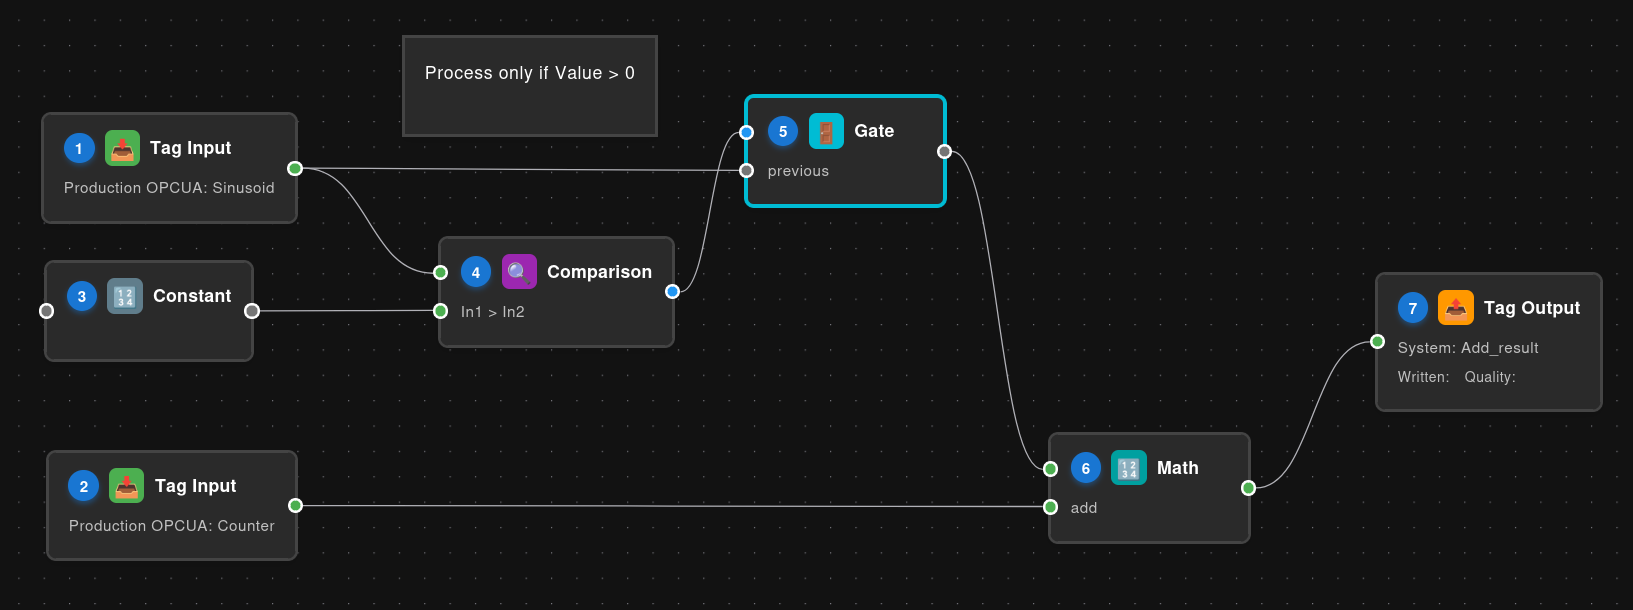
Understanding Execution Order
Execution order is determined by the dependency graph (node connections), not visual position on canvas. DataForeman uses topological sorting:
- Nodes with no incoming connections execute first (Tag Inputs, Constants, Triggers)
- Nodes execute only after dependencies are ready (all inputs have values)
- Multiple independent nodes may execute in any order
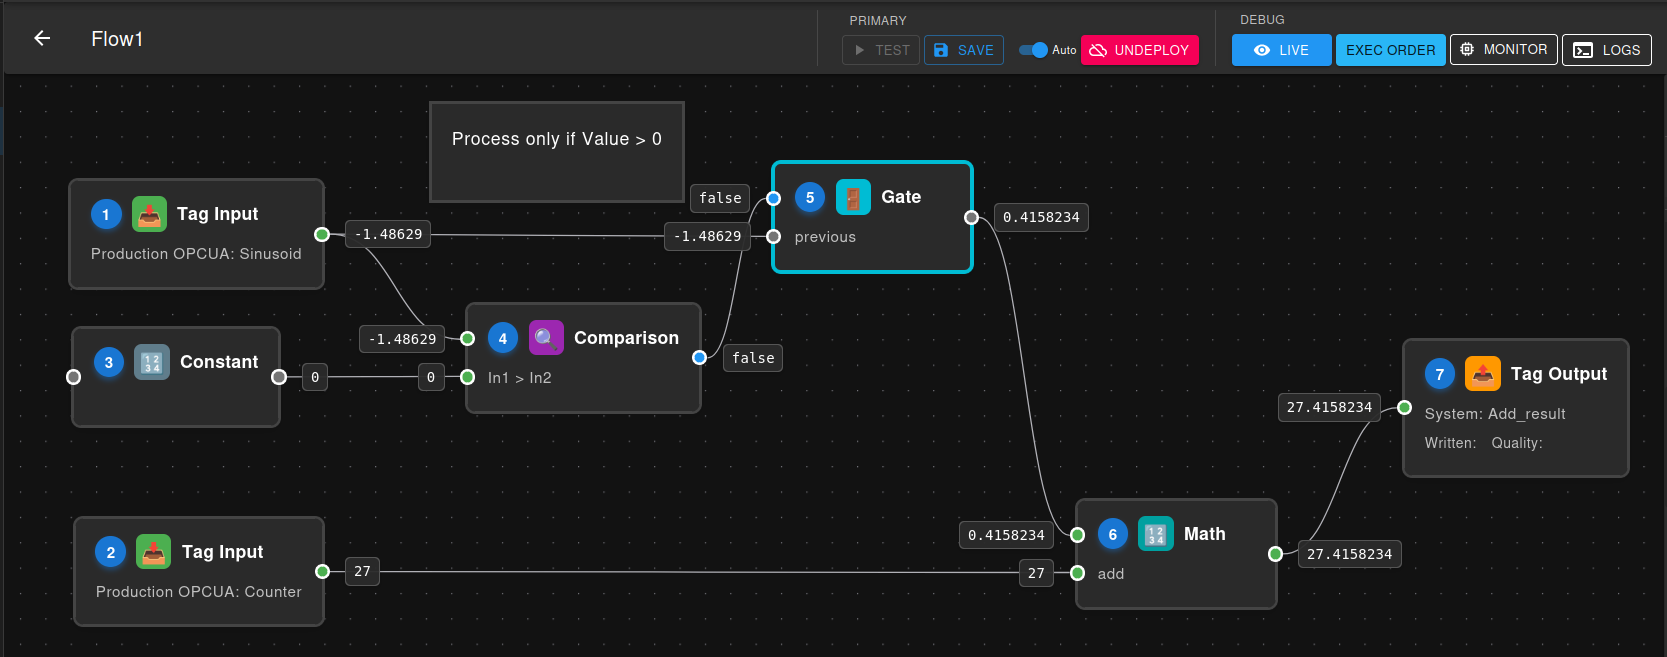
Example Flow: Conditional Addition
This example demonstrates conditional processing where two temperature values are added together only if a condition is met:
Execution Order:
- Tag Input A - Reads first value (no dependencies)
- Tag Input B - Reads second value (no dependencies)
- Constant (value: 0) - Provides threshold for comparison (no dependencies)
- Comparison - Compares Tag Input A against the Constant threshold (waits for Tag Input A + Constant)
- Gate - Controls whether Tag Input A passes through based on comparison result (waits for Comparison + Tag Input A)
- Math - Adds the gated value to Tag Input B (waits for Gate output + Tag Input B)
- Tag Output - Writes the final result (waits for Math)
Tip: Click the 123 button in the toolbar to show/hide execution numbers on each node.
Live Monitoring
Flow Studio provides Live Mode for real-time visualization of data flowing through your workflows. When a flow is deployed or in test mode, you can monitor:
Live Value Display:
- See current values on each node in real-time
- Values update automatically as the flow executes
- Color-coded indicators show data types
- Null/undefined values are clearly marked
Access Live Mode:
- Available during Test Run sessions
- Values refresh at each scan cycle
- No performance impact on flow execution
Live monitoring is essential for:
- Debugging: Verify data transformations step-by-step
- Validation: Confirm nodes receive expected values
- Troubleshooting: Identify where data flow breaks
- Learning: Understand how flows process data in real-time
Flow Logging System
Execution Logs
DataForeman automatically logs flow execution details to help you troubleshoot and monitor your workflows:
Log Storage:
- Logs are stored in the
flow_execution_logsdatabase table - Each log entry includes: timestamp, node ID, log level, message, and metadata
- Logs are retained based on per-flow retention settings (1-365 days, default: 30)
- High-resolution timestamps (microseconds) ensure proper log ordering
Log Levels:
- DEBUG: Detailed execution information (input/output values, calculations)
- INFO: General execution progress (node completions, results)
- WARN: Non-critical issues (degraded quality, fallback behavior)
- ERROR: Execution failures and exceptions
Viewing Logs:
- Press Ctrl+L or click “Show Logs” button to open the Log Panel
- Position panel at bottom or right side of editor
- Filter by log level, node ID, or search text
- Auto-scroll keeps newest logs visible
- Logs update in real-time during execution
Configuring Logging:
- IMPORTANT: Logging is disabled by default - enable it in Flow Settings → Execution Logs
- Set retention period (days) before logs are automatically deleted
- Logs are batched and written asynchronously for performance
- No performance impact on flow execution
Debug Log Node
The Debug Log node is a special utility for inspecting values at any point in your flow:
Purpose:
- Log intermediate values without affecting data flow
- Insert checkpoints for troubleshooting
- Monitor specific values during testing
- Values pass through unchanged (transparent logging)
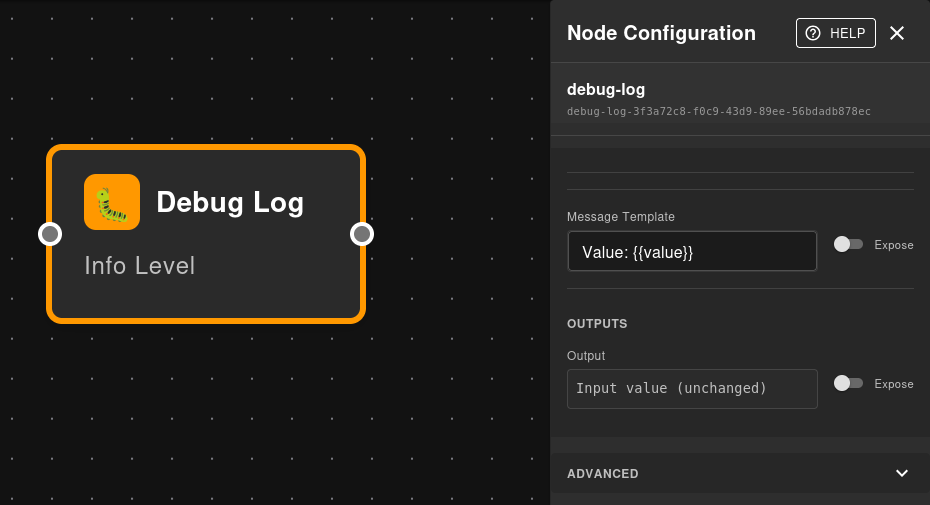
Features:
- Custom message templates with
{{value}}interpolation - Always logs at INFO level
- Zero impact on flow logic - pure observability
- Ideal for debugging complex flows
Example Usage:
Tag Input → Debug Log ("Temperature: {{value}}°C") → Math → Debug Log ("Calculated: {{value}}") → Tag Output
Note: Debug Log nodes can also be “dead-ended” (no output connection) with no impact - useful when you only want to log a value without continuing the flow.
View debug messages in the Log Panel during flow execution to trace data transformations step-by-step.
Performance Considerations
Tag Input Performance
Tag Input nodes read from an in-memory cache (~5ms) with automatic database fallback (~1400ms) on cache miss. Configure Maximum Data Age appropriately:
- Use
-1for best performance with cached values - Use
0for guaranteed fresh data (may impact performance) - Use custom age limits for balance between freshness and performance
Scan Rate Optimization
Choose scan rates based on your process requirements:
- Fast processes: 100-500ms for responsive control
- Standard monitoring: 1000ms (default) for most applications
- Slow processes: 5000-60000ms for efficiency with slow-changing data
Resource Monitor:
For continuous flows, DataForeman provides a Resource Monitor that tracks node execution performance in real-time. Access it by clicking the Monitor button in the toolbar (available when flow is deployed or in test mode).
The Resource Monitor displays:
- Scan Efficiency: Percentage of scan rate used by execution (should be <80%)
- Cycles per Second: Actual execution frequency
- Memory Usage: Peak and average memory consumption
- Scan Duration: Average and maximum cycle execution time
- Performance Warnings: Alerts for overloaded flows or slow nodes
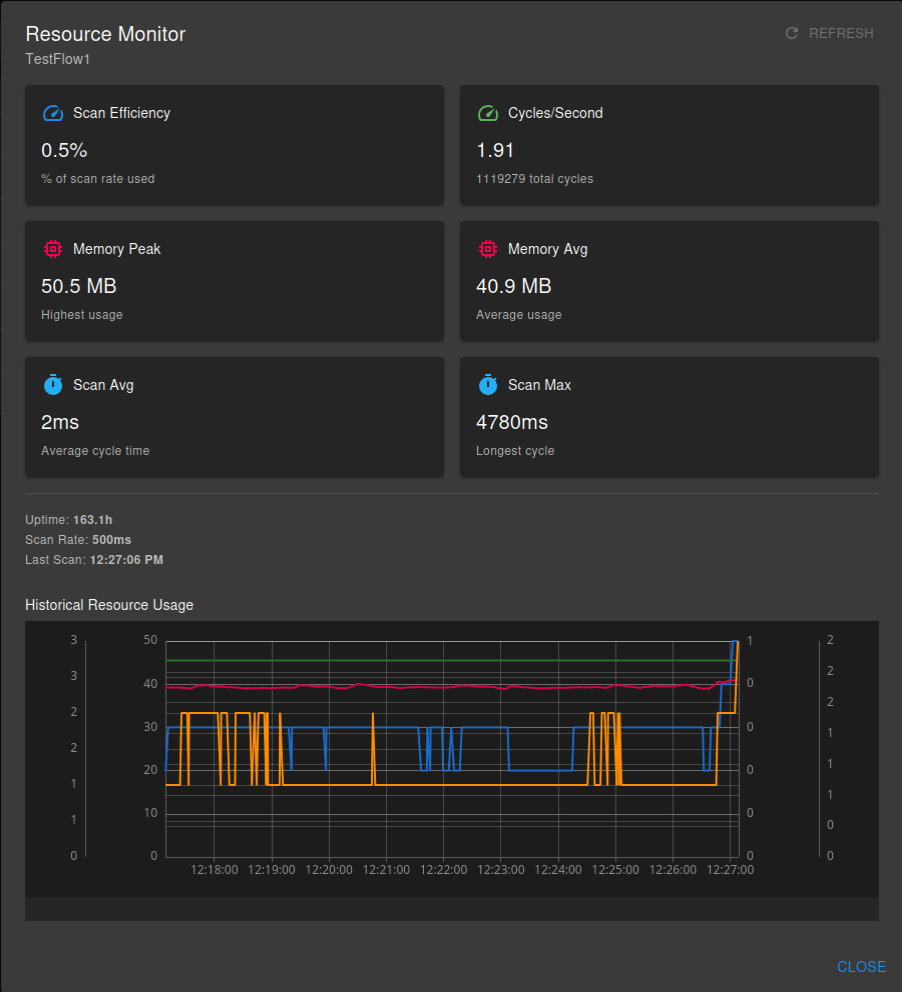
Use this tool to optimize scan rates and identify bottlenecks. If scan efficiency consistently exceeds 80%, consider:
- Increasing the scan rate (slower execution)
- Splitting the flow into multiple smaller flows
- Optimizing slow nodes (especially JavaScript nodes)
- Reducing the number of tag reads
Node Count
While flows support many nodes, consider:
- Complex flows with 50+ nodes may benefit from splitting into multiple flows
- JavaScript nodes have 5-second timeout - keep code efficient
- Each node adds execution overhead - optimize where possible
Advanced Features
Parameterized Flows
Expose node inputs/outputs to create reusable, configurable flows:
- In node configuration, toggle Expose to user
- Provide parameter name and description
- At execution time, users provide values
- Ideal for manual mode flows with variable inputs
Parameterized flows can be added to Dashboards for quick access and execution. Once a flow with parameters is added to a dashboard, users can:
- Trigger the flow directly from the dashboard interface
- Provide parameter values through dashboard input fields
- View execution results immediately
- Create operator-friendly interfaces for complex workflows
This makes parameterized flows perfect for creating reusable tools that non-technical users can execute on-demand without accessing the Flow Studio.
JavaScript Node Capabilities
Access powerful scripting with these special objects:
$input - Input values from connected nodes
|
|
$tags - Read tag values by name
|
|
$flow - Flow context and metadata
|
|
Flow Organization
Organize flows using the folder system:
- Create folders in Flow Browser
- Move flows into logical groups
- Use naming conventions for easy identification
- Archive old flows rather than deleting
Common Use Cases
Real-Time Calculations
Create derived values from multiple tags:
- Calculate OEE (Overall Equipment Effectiveness)
- Compute flow rates from totalizers
- Apply calibration curves to raw sensor data
- Aggregate values from multiple sources
Conditional Logic
Implement business rules and thresholds:
- Alarm generation based on multiple conditions
- Quality checks and reject logic
- Equipment interlocks and safety logic
- Process state tracking
Data Transformation
Process data before storage or display:
- Unit conversions
- Statistical calculations (rolling averages, standard deviation)
- Data filtering and smoothing
- Timestamp alignment
Report Generation
Manual mode flows for scheduled reports:
- Daily production summaries
- Quality reports
- Energy consumption reports
- Equipment runtime analysis
Integration & Automation
Connect systems and automate tasks:
- Write calculated values to PLC registers
- Synchronize data between systems
- Trigger actions based on events
- Batch data processing
Best Practices
Flow Design
- Keep it simple: Break complex logic into multiple flows
- Name clearly: Use descriptive names for flows and nodes
- Comment liberally: Add notes for complex logic
- Test thoroughly: Use Test Mode before deployment
- Version control: Export flows before major changes
Performance
- Optimize scan rates: Match process speed requirements
- Minimize JavaScript: Use native nodes where possible
- Cache tag reads: Set appropriate Maximum Data Age
- Monitor execution time: Watch for slow nodes
Maintenance
- Document purpose: Add flow descriptions
- Review regularly: Audit deployed flows periodically
- Clean up unused: Archive or delete obsolete flows
- Monitor errors: Check flow execution logs
- Update gradually: Test changes in Test Mode first
Troubleshooting
Flow Won’t Deploy
- Check for validation errors in nodes
- Verify all required connections exist
- Ensure tag selections are valid
- Check permission to write to output tags
Slow Execution
- Review scan rate setting
- Check for slow JavaScript code
- Verify database connectivity
- Reduce number of tag reads
Unexpected Results
- Use Test Mode with live monitoring
- Check node configuration values
- Verify execution order (show numbers)
- Review JavaScript node output
- Check tag data quality and age
Manual Triggers Not Working
- Verify flow is deployed or in test mode
- Check trigger connections
- Ensure scan rate isn’t too slow
- Review flow execution logs
Available Nodes
Complete reference of all built-in node types:
Tag Operations
Tag Input (tag-input)
- Read current value from a tag
- Configurable data age limits for freshness control
- Reads from in-memory cache with automatic DB fallback
- Outputs: value, quality, timestamp
Tag Output (tag-output)
- Write value to an INTERNAL tag via NATS
- Only works with driver_type = ‘INTERNAL’ tags
- Write-on-change mode to minimize unnecessary writes
- No outputs (sink node)
Constant (constant)
- Output static values (number, string, boolean, JSON)
- No inputs - generates constant output
- Useful for thresholds, configuration values, and test data
Manual Trigger (trigger-manual)
- Control flow execution with a button
- Continuous mode: outputs true for one scan when clicked
- Manual mode: outputs true when flow executes
- No configuration required
Logic & Math
Math (math)
- Operations: add, subtract, multiply, divide, average, min, max
- Custom formula support with Math functions
- Supports 2+ dynamic inputs
- Number validation with skipInvalid option
Comparison (comparison)
- Compare two values: gt, lt, gte, lte, eq, neq
- Optional tolerance for equality checks
- Returns boolean result
Gate (gate)
- Control data flow based on boolean condition
- When true: passes input through
- When false: outputs null or holds previous value
- Useful for conditional execution patterns
Boolean Logic (boolean-logic)
- Logical operations: AND, OR, XOR, NOT, NAND, NOR
- 1 input for NOT, 2-10 inputs for others
- Boolean type validation
Switch (switch)
- Route value to different outputs based on case matching
- Similar to switch/case statement in programming
- 1-10 configurable cases plus default output
- Value-based routing logic
Range Check (range-check)
- Check if value is within min/max range
- Returns boolean (in range) + original value
- Useful for validation and limit checking
Merge (merge)
- Combine multiple inputs using various strategies
- Strategies: first-valid, first-non-null, highest-quality, latest, min, max, average, sum
- 2-4 inputs with optional redundancy handling
- Quality-aware merging
Clamp (clamp)
- Limit value to specified min/max range
- Enforces boundaries on numeric values
- Common for setpoint limiting and safety bounds
Round (round)
- Rounding operations: round, floor, ceil, truncate
- Configurable precision (decimals, tens, hundreds, etc.)
- Clean up floating-point precision issues
Data Transform
Type Convert (type-convert)
- Convert between types: number, string, boolean
- Handles edge cases (NaN, null, undefined)
- Safe conversion with fallback values
String Operations (string-ops)
- Operations: substring, concat, replace, uppercase, lowercase, trim, split, join
- 1-5 inputs depending on operation
- Text processing and formatting
Array Operations (array-ops)
- Operations: get-element, length, first, last, join, slice, includes, index-of
- Supports negative indexing
- Array manipulation and inspection
JSON Operations (json-ops)
- Operations: parse, stringify, get-property, has-property, keys, values
- Dot notation property access (e.g., “user.address.city”)
- JSON processing and object manipulation
Scripts
JavaScript (script-js)
- Custom JavaScript code execution in sandboxed VM
- Access to
$input,$tags,$flow,$fsAPIs - 5-second timeout
- Async/await support for asynchronous operations
Utility
Debug Log (debug-log)
- Log values to execution log for troubleshooting
- Custom message template with
{{value}}interpolation - Values pass through unchanged
- Always logs at INFO level
Comment (comment)
- Add text comments and documentation to flows
- Passive node - does not execute or process data
- Resizable for long notes
- Useful for explaining complex logic
Delay (delay)
- Delay value by specified duration (milliseconds)
- Time-based delay in continuous flows
- Synchronous wait in manual flows
- Useful for debouncing and sequencing
Jump Out / Jump In (jump-out, jump-in)
- Virtual connectors for clean flow layout
- No visible edge drawn between paired nodes
- Paired by matching jump labels
- Reduces visual clutter on complex flows
Need help with Flow Studio? Contact support or report issues on GitHub.