System Monitoring
Monitor system health, diagnose issues, and track performance using the built-in Diagnostics page.
Accessing Diagnostics
- Login to DataForeman
- Navigate to Diagnostics from the main menu
- Three tabs available:
- Overview & Logs: Service status and logs
- Capacity: Storage and resource usage
- Jobs: Background task management
Note: Requires diagnostic permissions. Contact administrator if access denied.
Overview & Logs Tab

Service Health Status
Docker Services:
- Real-time status of all containers
- Green = running, Red = stopped
- Uptime information
- Resource usage indicators
Services monitored:
- Core (API server)
- Connectivity (device communication)
- Ingestor (data storage)
- Front (web interface)
- NATS (messaging)
- PostgreSQL (main database)
- TimescaleDB (time-series database)
- Caddy (reverse proxy)
Live Logs
Log Viewer:
- Real-time log streaming
- Filter by service
- Search within logs
- Auto-scroll toggle
- Severity levels (INFO, WARN, ERROR)
Using the log viewer:
- Select service from dropdown
- Logs stream automatically
- Use search box to filter
- Toggle auto-scroll as needed
- Click refresh to reload
System Information
Database Status:
- Connection count
- Active queries
- Database sizes
- Table statistics
Service Metrics:
- Tag update rates
- Messages per second
- Connection status
- Poll group performance
Capacity Tab
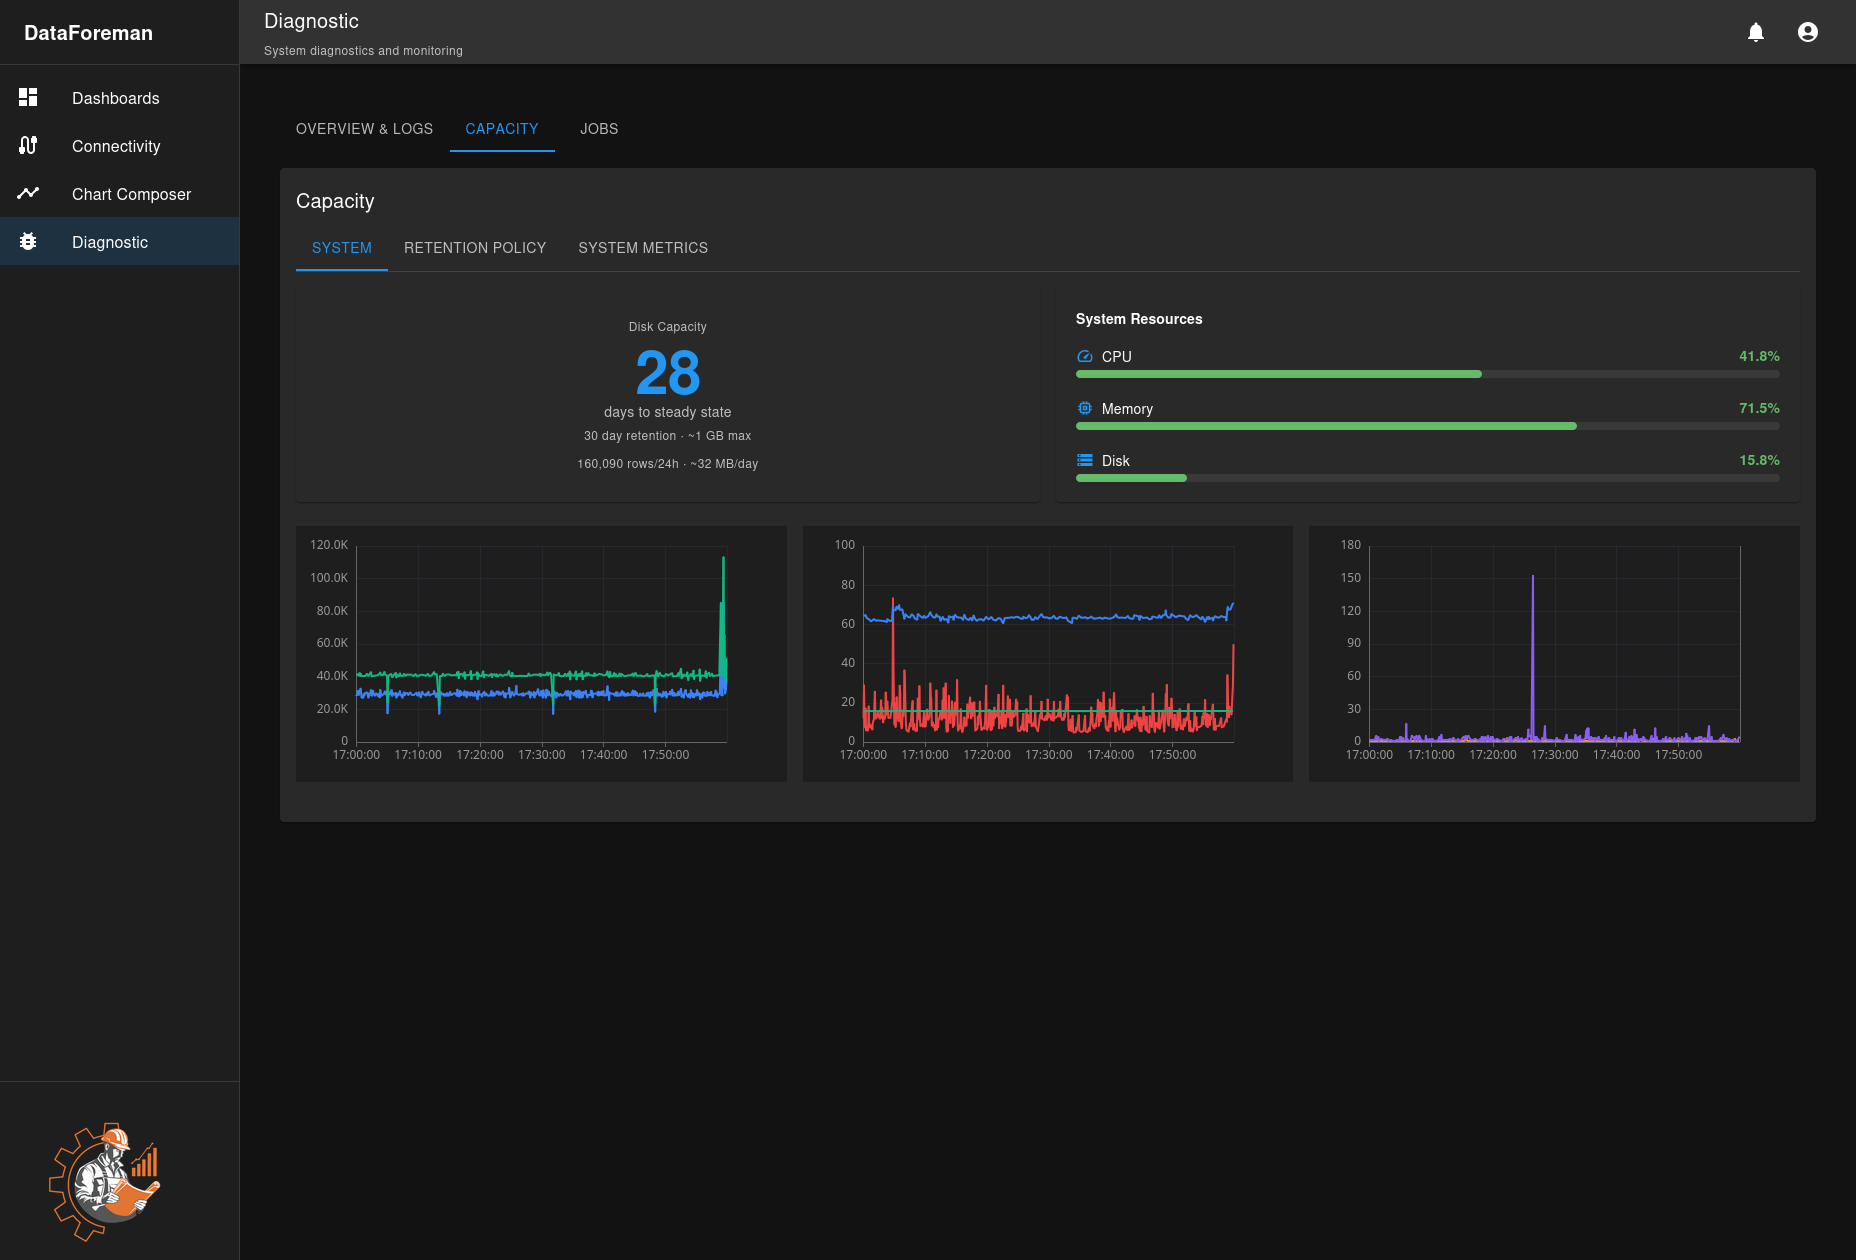
Storage Usage
Database Size:
- Main database (PostgreSQL)
- Time-series database (TimescaleDB)
- Growth trends over time
- Utilization percentages
Disk Space:
- Total disk capacity
- Used vs. available space
- Log file sizes
- Docker volume usage
Data Statistics
Tag Counts:
- Total tags configured
- Active vs. inactive tags
- Tags by connection
- Tags by poll group
Time-Series Data:
- Data points stored
- Storage per tag
- Data retention
- Compression ratios
Performance Metrics
Polling Performance:
- Tags polled per second
- Poll group statistics
- Average latency
- Error rates
Database Performance:
- Write throughput
- Query performance
- Index efficiency
- Connection pool usage
Jobs Tab
Background Jobs
Job Types:
- Data cleanup tasks
- Backup operations
- Maintenance routines
- Scheduled reports
Job Information:
- Job status (running, completed, failed)
- Start and end times
- Progress indicators
- Error messages
Job Management
Viewing Jobs:
- List all background jobs
- Filter by status
- Sort by date
- View job details
Job Actions:
- Cancel running jobs (if supported)
- Retry failed jobs
- View job logs
- Schedule new jobs (admin only)
Monitoring Best Practices
Daily Checks
- Review service status (all green)
- Check for ERROR logs
- Monitor disk space usage
- Verify tag update rates
Weekly Checks
- Review database sizes
- Check job completion
- Monitor resource trends
- Review capacity warnings
Monthly Checks
- Full capacity review
- Performance analysis
- Clean old logs
- Update documentation
Common Issues
Service Down
Symptom: Service shows as stopped in Overview Solution:
- Check Diagnostics → Overview tab
- Note which service is down
- Contact system administrator
- Check system logs for errors
High Disk Usage
Symptom: Capacity tab shows >90% disk usage Solution:
- Review database sizes
- Enable write-on-change deadbands
- Implement data retention
- Contact administrator for cleanup
Slow Performance
Symptom: Charts load slowly, delays in UI Solution:
- Check Capacity tab for resource usage
- Review tag polling rates
- Reduce poll frequency if needed
- Check for high CPU services
Connection Errors
Symptom: Tags not updating, red connection status Solution:
- Check Overview → Live Status
- Review connection logs
- Verify device network connectivity
- See Device Setup for troubleshooting
Performance Indicators
Healthy System
- All services green in Overview
- Disk usage <80%
- Tag updates consistent
- No ERROR logs in recent activity
- Jobs completing successfully
Warning Signs
- Any service red/stopped
- Disk usage >80%
- Frequent ERROR logs
- Tags not updating
- Failed background jobs
Critical Issues
- Multiple services down
- Disk full (>95%)
- Database connection failures
- Continuous ERROR logs
- System unresponsive
Alert Thresholds
Monitor these metrics:
- Disk Space: Alert at 80%, critical at 90%
- Database Size: Plan capacity at 1TB
- Tag Update Rate: Should match configured poll rates
- Service Uptime: All services should be continuous
- Error Logs: Investigate any ERROR entries
Related Documentation
- Troubleshooting - Common problems and solutions
- User Management - Managing user access
- Permission System - Configuring diagnostic access