Device Connectivity
DataForeman supports multiple industrial protocols to connect to your devices, collect data, and store it for analysis. The Connectivity module handles all device communication and data acquisition.
Overview
The Connectivity module provides:
- Multi-Protocol Support: OPC UA, Siemens S7, EtherNet/IP (Allen-Bradley PLCs)
- Tag Browser: Visual interface to discover and select data points
- Real-Time Monitoring: Live status indicator showing active connections
- Auto-Discovery: Automatic device and tag detection (protocol-dependent)
- Data Quality: Connection health and data quality indicators
Supported Protocols
INTERNAL Tags
Use Cases:
- Calculated values from Flow Studio
- Virtual data points
- Flow outputs and intermediate results
- System-generated values
Features:
- No external device required
- Created and written by Flow Studio flows
- Full integration with dashboards and charts
- Same data quality and history as device tags
- Support all standard data types
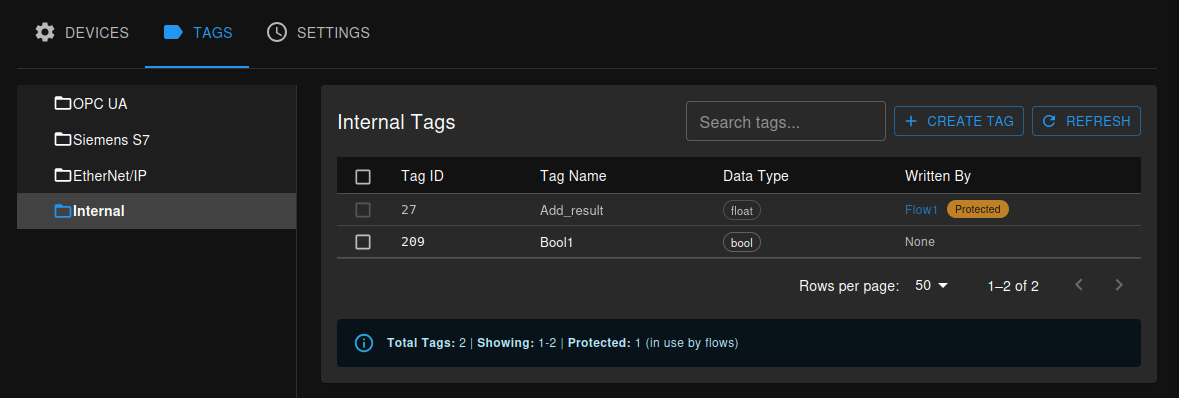
Creating INTERNAL Tags:
INTERNAL tags are special tags that don’t connect to external devices. They are used as outputs from Flow Studio flows or as virtual data points:
- Navigate to the TAGS tab, Internal section
- Click + CREATE TAG button
- Configure the tag:
- Tag Name: Descriptive identifier
- Data Type: Choose appropriate type (Number, String, Boolean, JSON)
- Description: Purpose and usage notes
Writing to INTERNAL Tags:
INTERNAL tags can only be written via:
- Flow Studio: Use Tag Output nodes in flows
- API: Programmatic updates via REST API
They cannot be written from external devices or manual data entry.
Use in Flows:
INTERNAL tags are commonly used to:
- Store calculated KPIs (OEE, efficiency, throughput)
- Aggregate data from multiple sources
- Generate derived metrics
- Create virtual sensors
- Store report outputs
See Flow Studio for complete flow creation guide.
Tag Management and Protection:
The Tags table includes a Written By column that shows which flow is writing to each INTERNAL tag. This column provides a direct link to the corresponding flow for easy navigation and maintenance.
Important: INTERNAL tags cannot be deleted if they are currently used in any flow. The system prevents accidental deletion of tags that are actively being written to. To delete a protected tag:
- Navigate to the flow using the link in the Written By column
- Remove or modify the Tag Output node that writes to this tag
- Save the flow
- Return to Tags tab - the tag can now be deleted
This protection ensures data integrity and prevents broken flow configurations.
OPC UA (OPC Unified Architecture)
Use Cases:
- Modern SCADA systems
- Industrial IoT gateways
- Multi-vendor equipment integration
Features:
- Browse server node tree
- Subscribe to value changes
- Secure authentication (username/password, certificates)
- Automatic reconnection on network issues
Siemens S7
Use Cases:
- Siemens PLCs (S7-300, S7-400, S7-1200, S7-1500)
- Direct PLC communication
- High-speed data collection
Features:
- Read data blocks (DB)
- Support for all S7 data types
- Optimized batch reading
- Slot and rack configuration
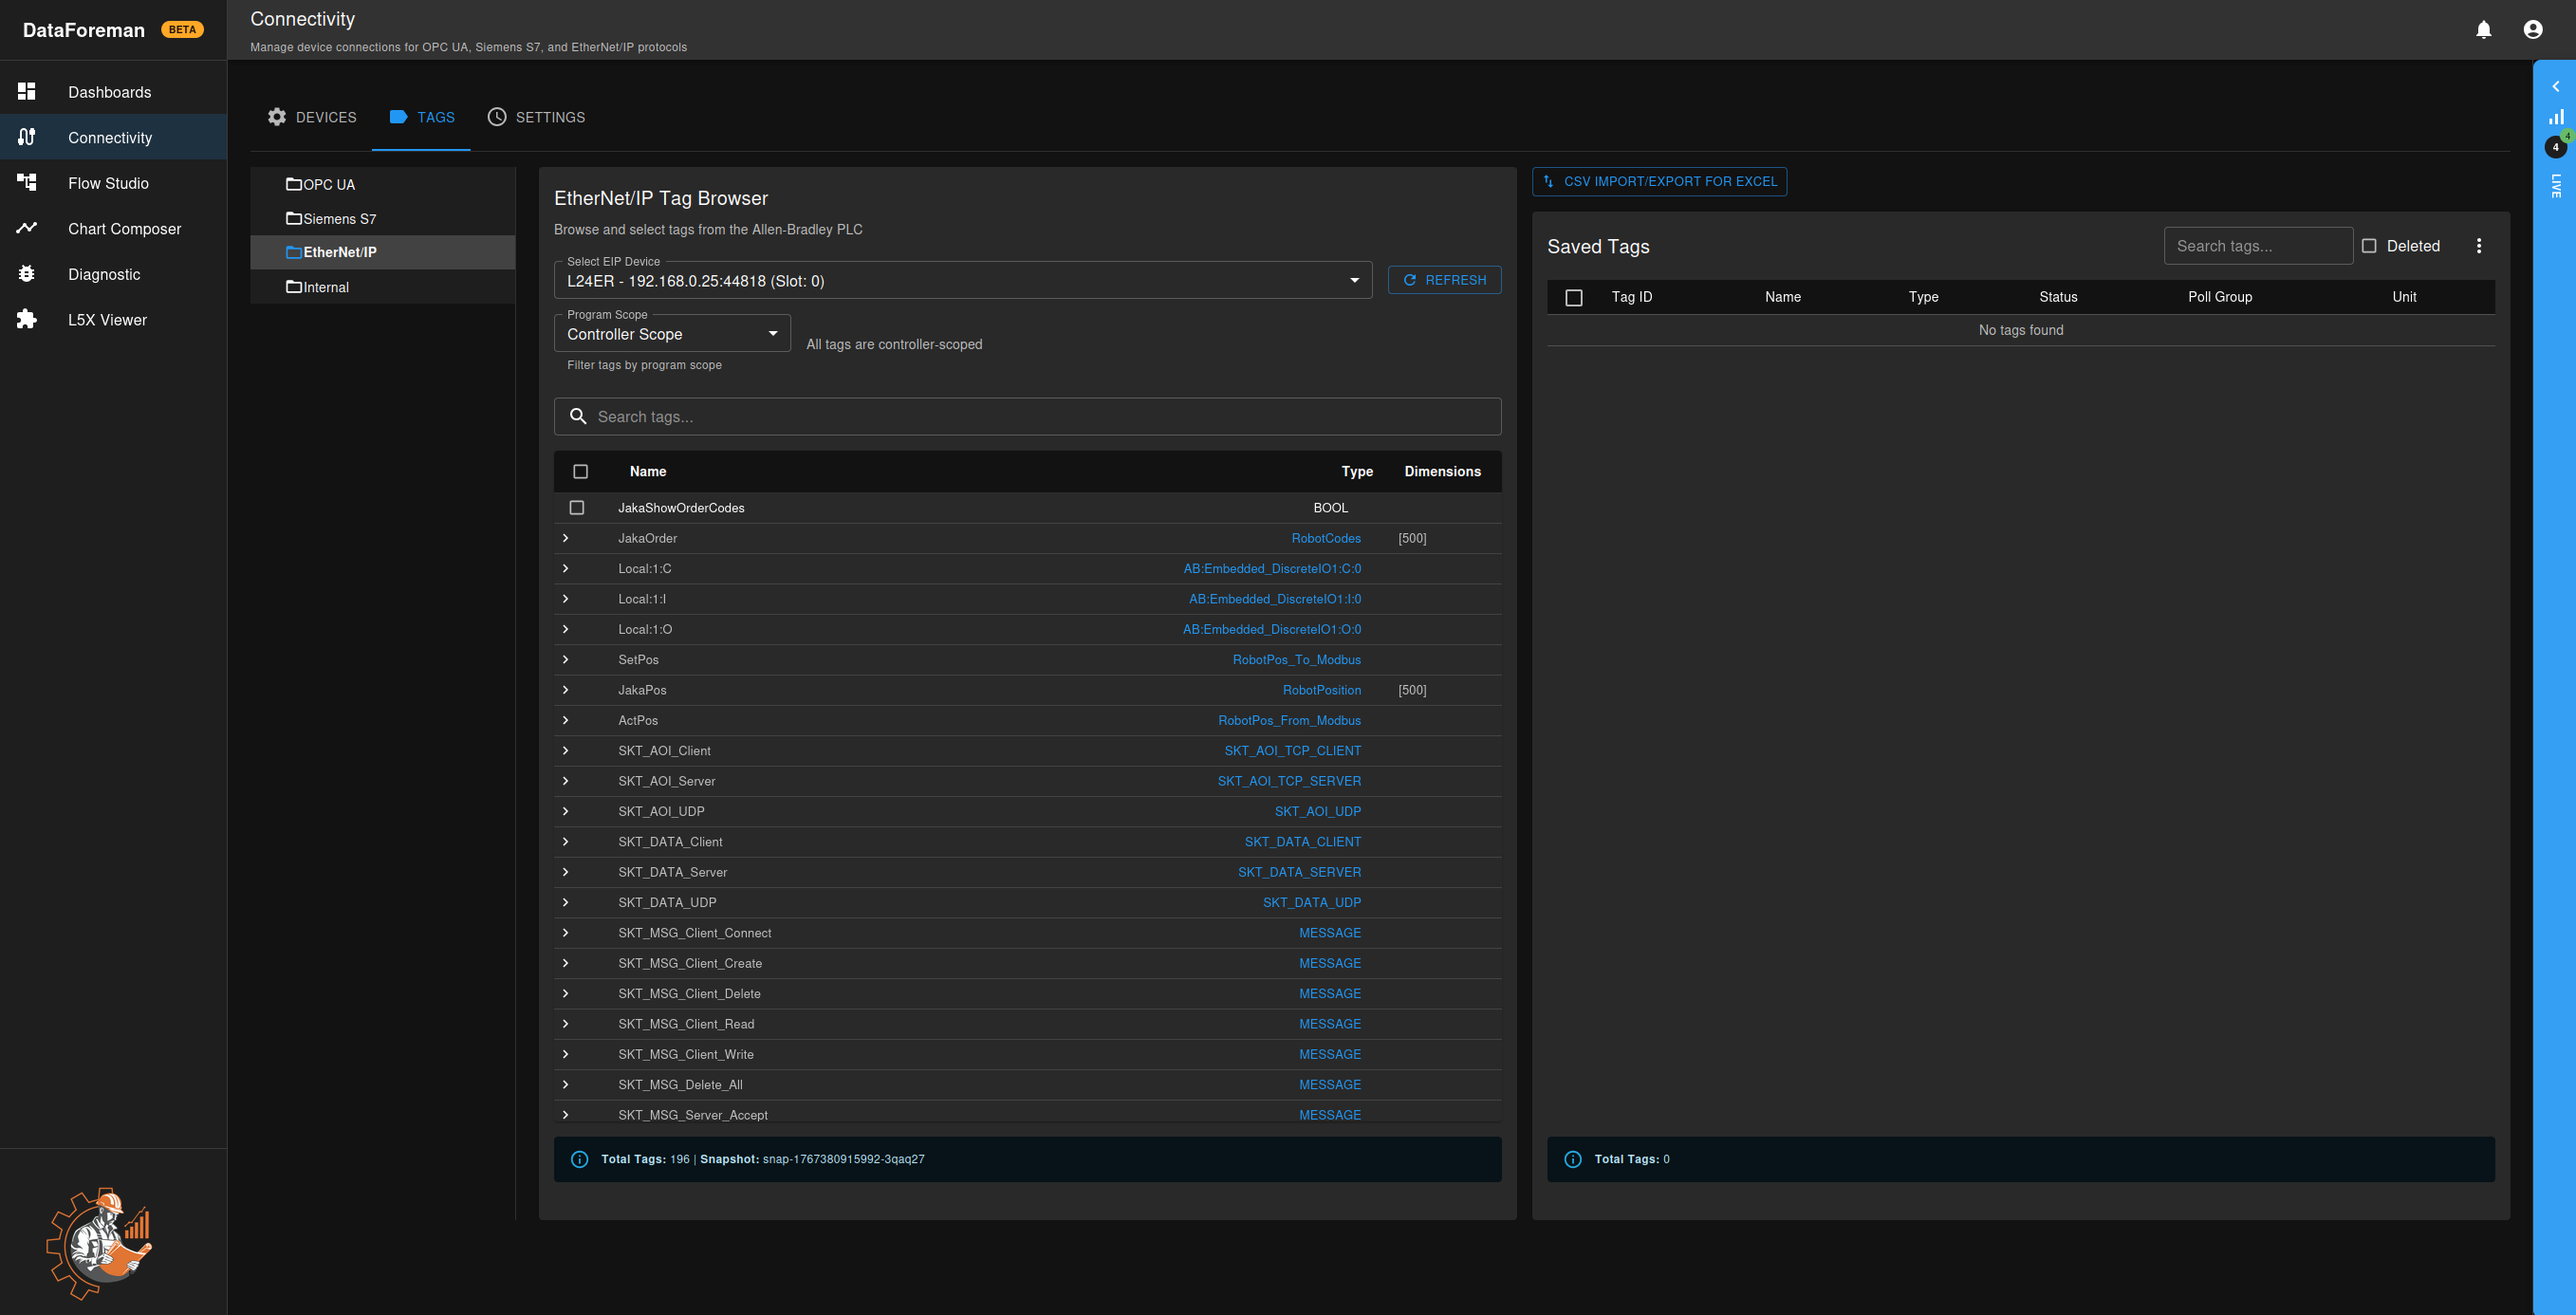
EtherNet/IP (Allen-Bradley)
Use Cases:
- Rockwell Automation PLCs (ControlLogix, CompactLogix)
- Allen-Bradley devices
- Ethernet-based industrial networks
Features:
- Multi-rate polling (different tags at different speeds)
- Program-scoped tag browsing
- Structure and UDT support
- Connection rate optimization
Getting Started
Step 1: Navigate to Connectivity
Click the Connectivity icon in the left sidebar.
Step 2: Select Protocol Tab
Choose the protocol that matches your device:
- OPC UA tab for OPC servers
- SIEMENS S7 tab for Siemens PLCs
- ETHERNET/IP tab for Allen-Bradley PLCs
Step 3: Create a Connection
- Click Setup New Connection
- Fill in the connection details (see protocol-specific sections below)
- Click Test Connection to verify (OPC UA only)
- Click Save to create the connection
OPC UA Connection Setup
Required Information
- Connection Name: Descriptive name for this connection
- Endpoint URL: OPC UA server address (e.g.,
opc.tcp://192.168.1.100:4840) - Security Mode: None, Sign, or SignAndEncrypt
- Authentication: Anonymous, Username/Password, or Certificate
Configuration Steps
- Enter the endpoint URL of your OPC UA server
- Select security mode (start with “None” for testing)
- If required, enter username and password
- Click Browse Endpoints to auto-detect server capabilities
- Test the connection
- Save the configuration
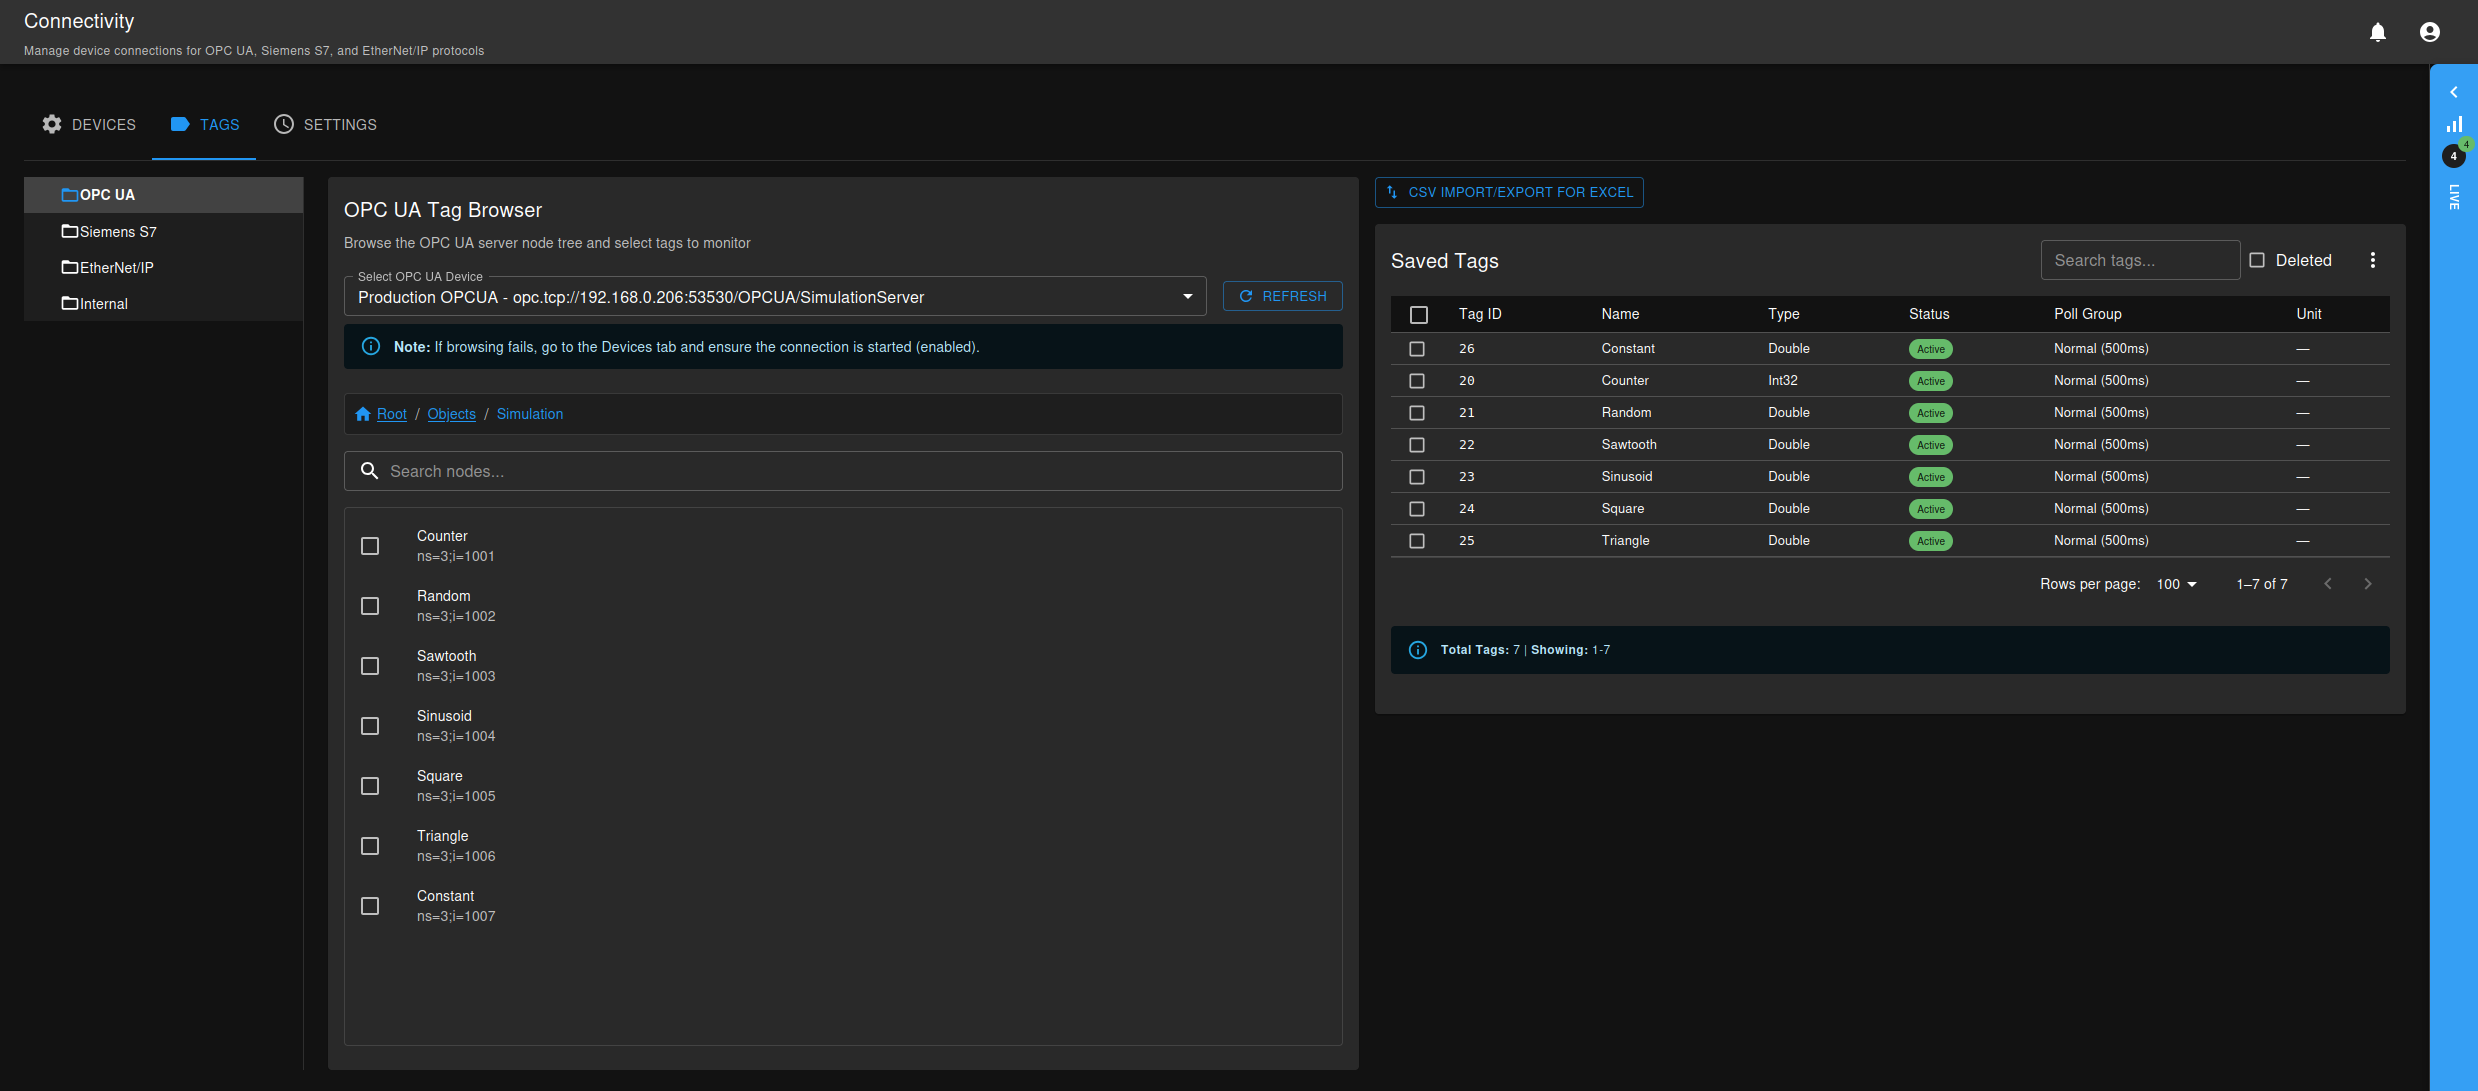
Browsing Tags
Once connected:
- Go to the TAGS tab
- Select your OPC UA connection from the dropdown
- Expand the node tree to find your data points
- Select tags you want to monitor using checkboxes
- Choose a poll group for the selected tags
- Click Save X Tags button to start data collection
Siemens S7 Connection Setup
Required Information
- Connection Name: Descriptive name
- IP Address: PLC IP address (e.g., 192.168.1.50)
- Rack: Usually 0 for most setups
- Slot: Usually 1 for S7-300/400, 0 for S7-1200/1500
- PLC Type: Select your PLC model
Configuration Steps
- Enter the PLC IP address
- Configure rack and slot numbers
- Select the PLC type from the dropdown
- Test the connection
- Save the configuration
Adding Tags
S7 tags must be added manually via the Tags tab:
- Go to the TAGS tab
- Select your S7 connection
- Enter tag information:
- Tag Name: Display name for the tag
- Tag Path: S7 address (e.g.,
DB1.DBW0,I0.0,Q0.1,M0.0) - Data Type: Select from dropdown (BOOL, BYTE, INT, DINT, REAL, etc.)
- Poll Group: Choose polling rate
- Click Add Tag to save and start monitoring
Common S7 Address Formats:
- Data Blocks:
DB1.DBX0.0(bit),DB1.DBW2(word),DB1.DBD4(double word) - Inputs:
I0.0(bit),IW2(word),ID4(double word) - Outputs:
Q0.0(bit),QW2(word),QD4(double word) - Markers:
M0.0(bit),MW2(word),MD4(double word)
EtherNet/IP Connection Setup
Required Information
- Connection Name: Descriptive name
- IP Address: PLC IP address
- Slot: Usually 0 for ControlLogix, varies for CompactLogix
- Timeout: Connection timeout in milliseconds (default: 5000)
Configuration Steps
- Enter the PLC IP address
- Set the slot number (check your PLC configuration)
- Adjust timeout if needed for slower networks
- Test the connection
- Save the configuration
Browsing Tags
EtherNet/IP supports multiple methods for adding tags:
Method 1: Auto-Discovery
- Go to the TAGS tab
- Select your EtherNet/IP connection
- Click Discover Tags to scan the PLC
- Select tags from the discovered list
- Choose poll group and save
Method 2: Manual Entry
- Enter tag names manually (one per line or comma-separated)
- System will resolve data types automatically
- Choose poll group and save
Method 3: CSV Import
- Click CSV Import/Export
- Use spreadsheet to define tags in bulk
- Import the CSV file
Tag Path Examples:
- Controller tags:
TagName - Structure members:
StructTag.Member - Array elements:
ArrayTag[0] - Program-scoped:
Program:MainProgram.TagName
Live Status Monitor
The LIVE indicator in the top-right shows:
- Green (4/4): All connections active and healthy
- Yellow (3/4): Some connections have issues
- Red (0/4): No active connections
- Gray: Connectivity service not running
Click the indicator to see detailed status for each connection.
Tag Management
Tags Tab
The TAGS tab provides protocol-specific tag browsers and management:
- OPC UA: Tree-based node browser with hierarchical navigation
- Siemens S7: Manual tag entry with S7 addressing
- EtherNet/IP: Auto-discovery, manual entry, or CSV import
For detailed information on tag management, see the Tag Management guide.
Settings Tab
The Settings tab provides system-wide configuration:
- Poll Groups: Configure multi-rate polling (different tags at different speeds)
- Units of Measure: Define engineering units (°C, PSI, RPM, etc.)
Poll Groups allow you to optimize data collection:
- Fast rates (50-250ms) for critical control variables
- Standard rates (1-2s) for normal monitoring
- Slow rates (5-60s) for setpoints and status
See Tag Management for complete poll group details.
Data Quality Indicators
Each tag has a quality indicator:
- Good: Data is current and valid
- Uncertain: Data may be stale or estimated
- Bad: No communication or invalid data
Troubleshooting
Cannot Connect to Device
-
Check Network:
- Ping the device IP address
- Verify firewall rules allow traffic
- Check network cables and switches
-
Verify Settings:
- Confirm IP address is correct
- Check rack/slot numbers (S7)
- Verify endpoint URL (OPC UA)
-
Protocol-Specific:
- OPC UA: Check security mode matches server
- S7: Ensure PLC has accessible data blocks
- EIP: Verify slot number and communication path
Tags Not Updating
- Connection Status: Check live status indicator
- Tag Configuration: Verify tag addresses are correct
- Poll Rate: Confirm poll rate is appropriate
- PLC Program: Check if PLC is in RUN mode
Performance Issues
- Reduce Poll Rate: Slow down non-critical tags
- Batch Optimization: Adjust batch sizes in settings
- Connection Limits: Check PLC connection limits
- Network Load: Monitor network bandwidth usage
Best Practices
Security
- Use secure authentication when possible
- Limit network access to DataForeman server
- Use VLANs to separate OT and IT networks
- Regularly update PLC and server firmware
Performance
- Group tags by poll rate (fast, medium, slow)
- Use appropriate data types (don’t read DWORD for BOOL)
- Limit total tag count per connection (< 1000 recommended)
- Monitor CPU and memory usage in Diagnostics
Organization
- Use clear, descriptive connection names
- Follow consistent naming conventions for tags
- Document rack/slot configurations
- Maintain an inventory of connected devices
Next Steps
- Learn how to visualize collected data in Chart Composer
- Create dashboards with your tags in Dashboard Creation
- Monitor system health in Diagnostics